Strategy report · Updated May 7, 2026
What's working for @buffer on Instagram.
Buffer
108.7K followers · 2.2K posts
“Create & share social media content anywhere, consistently. Built with 💙 by a global, remote team. ⬇️ Links from our posts”
Engagement rate
0.05%
Per post, last 90 days
Posts per week
2.3
Niche avg 4.0
Average likes
54
4 avg comments
Post mix
Last 90 days · 2,174 posts indexed
01
Top-performing posts
The three posts pulling the most engagement in the last 90 days.
 reel 0.16% engaged
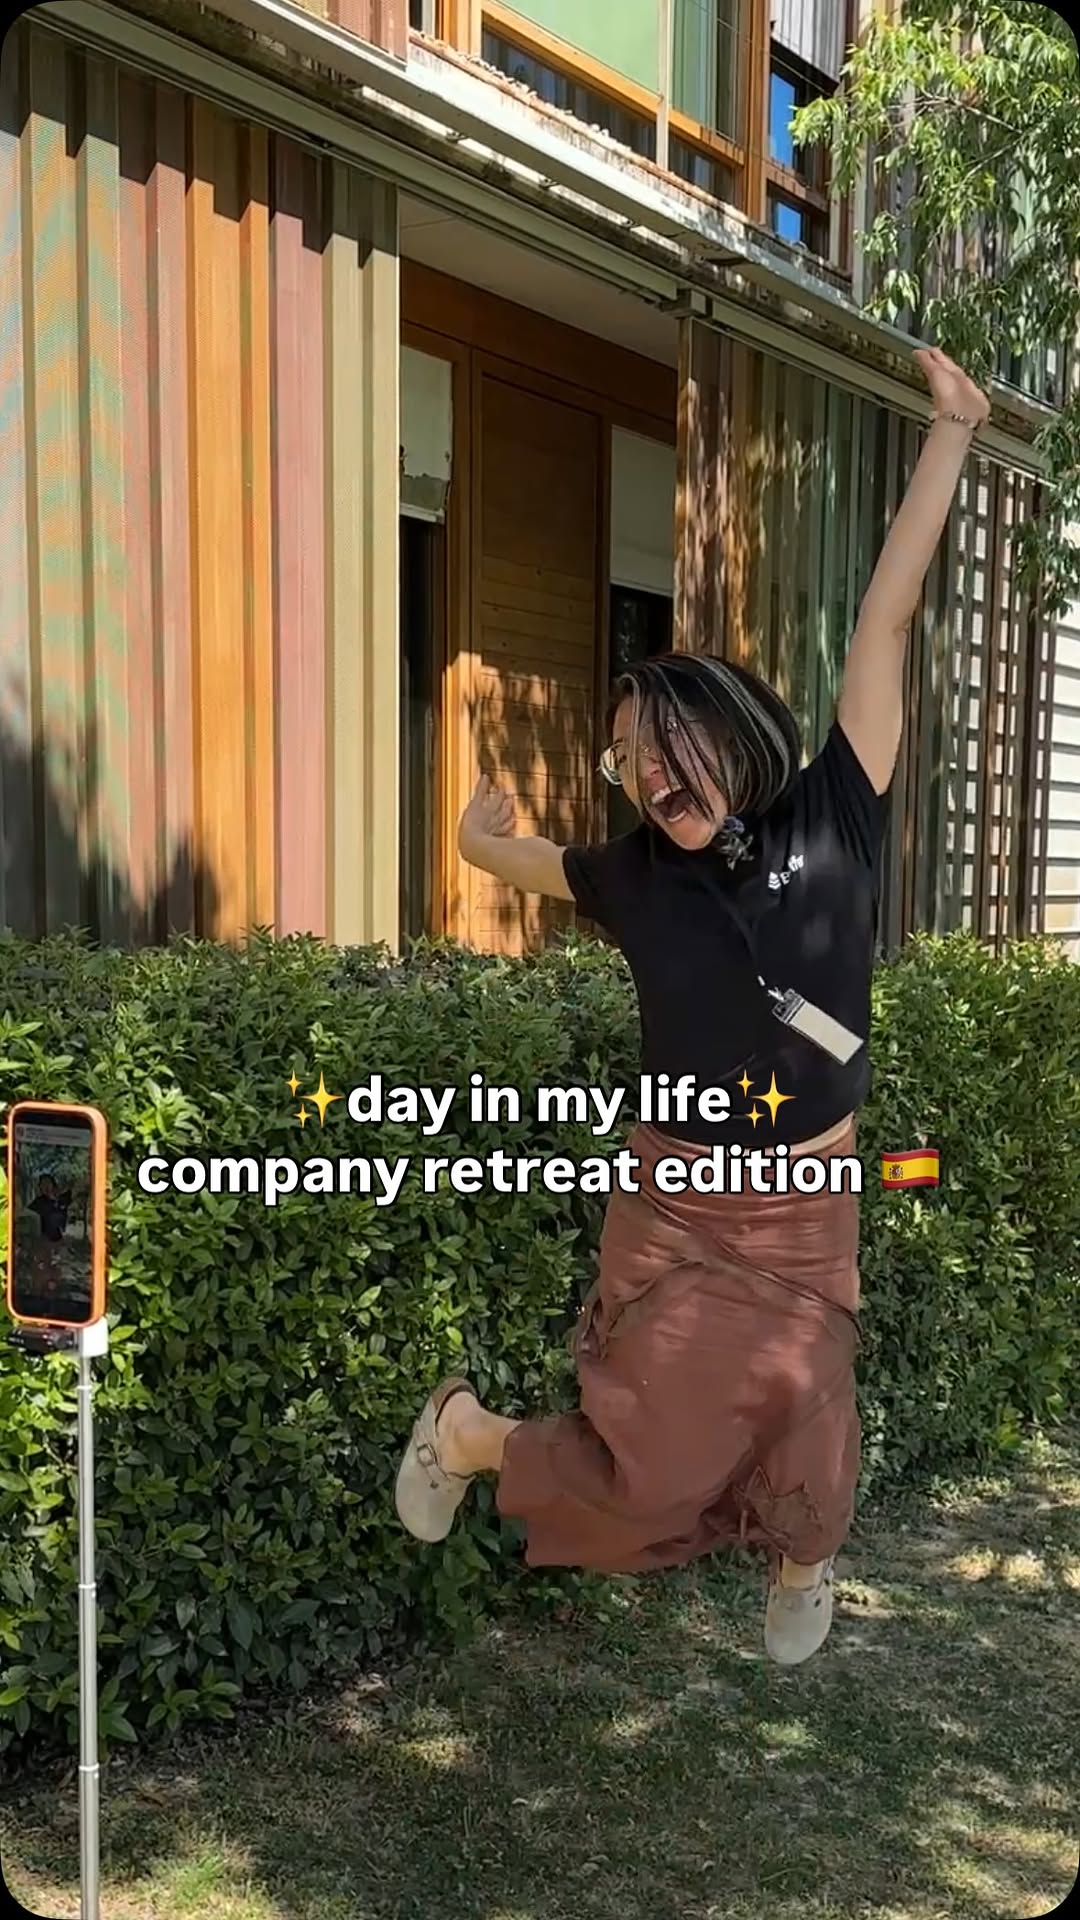
i can’t feel my legs new job alert💚 here is a day in my life as a community manager at @buffer 🏕️company retreat edition at barcelona 🇪🇸 #remotework #marketing #tech #creatoreconomy #socialmedia
 reel 0.14% engaged
DAY 1: Reporting live from Buffer’s 2026 annual retreat in Barcelona, Spain! 🇪🇸✨ #annualretreat #barcelona
 carousel 0.12% engaged
Meet our newest teammate and Senior Engineer at Buffer: Bruno Paulino! 🥳 Finding the right Senior Engineer for the team meant looking for someone who cared deeply about the people using Buffer, and who could thrive in a culture of trust and autonomy. Bruno came to engineering through an unconventional path, and that perspective shows in how he thinks about building. He cares about software that doesn’t just work, but actually feels good to use. Originally from Brazil and now based in Barcelona, swipe through to meet the newest Bufferoo. We’re so glad you’re here, Bruno! 💙 #bufferculture #newhire
02
Content pillars
AI-clustered themes the account posts about, with example posts pulled live from Instagram.


03
Posting rhythm
Cadence and timing patterns over the last 12 weeks.
2.3 posts/week
Niche benchmark · 4.0/week
Best days
Monday · Wednesday · Thursday
Best hours
8-10am · 12-2pm
04
Signature hooks
Caption patterns the account reuses across high-performing posts.
We analyzed [X]M+ posts to find [insight].
Used 6×
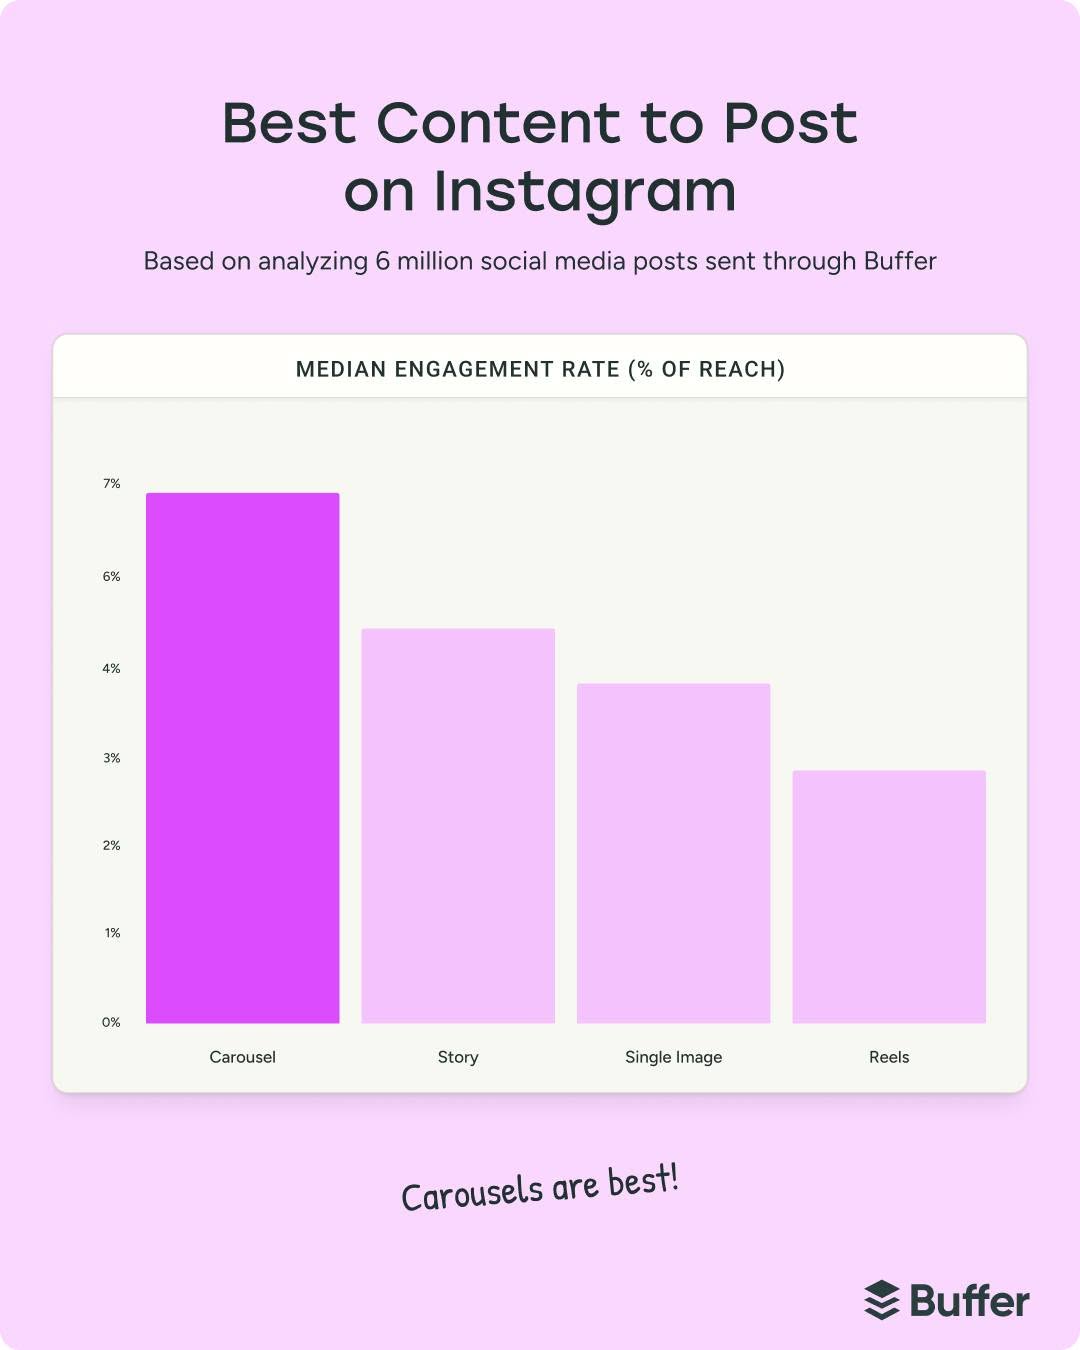
We analyzed 45M+ posts across every major social platform to find which content format actually drives the most engagement.

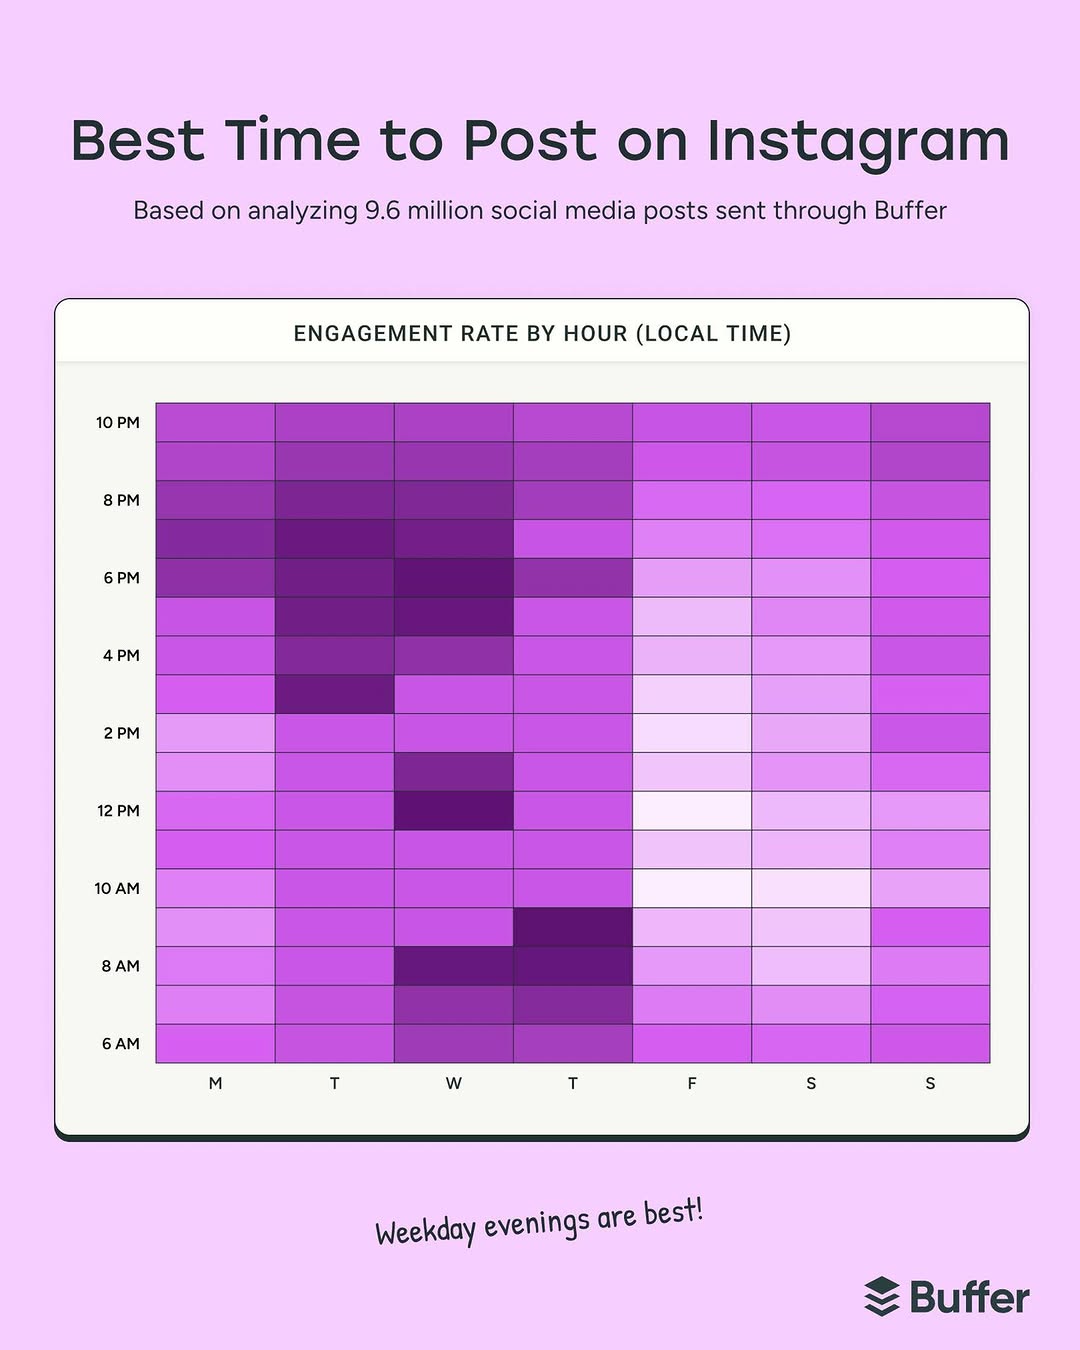
We analyzed 14 million Facebook posts to answer a question we get constantly: when should I actually post?
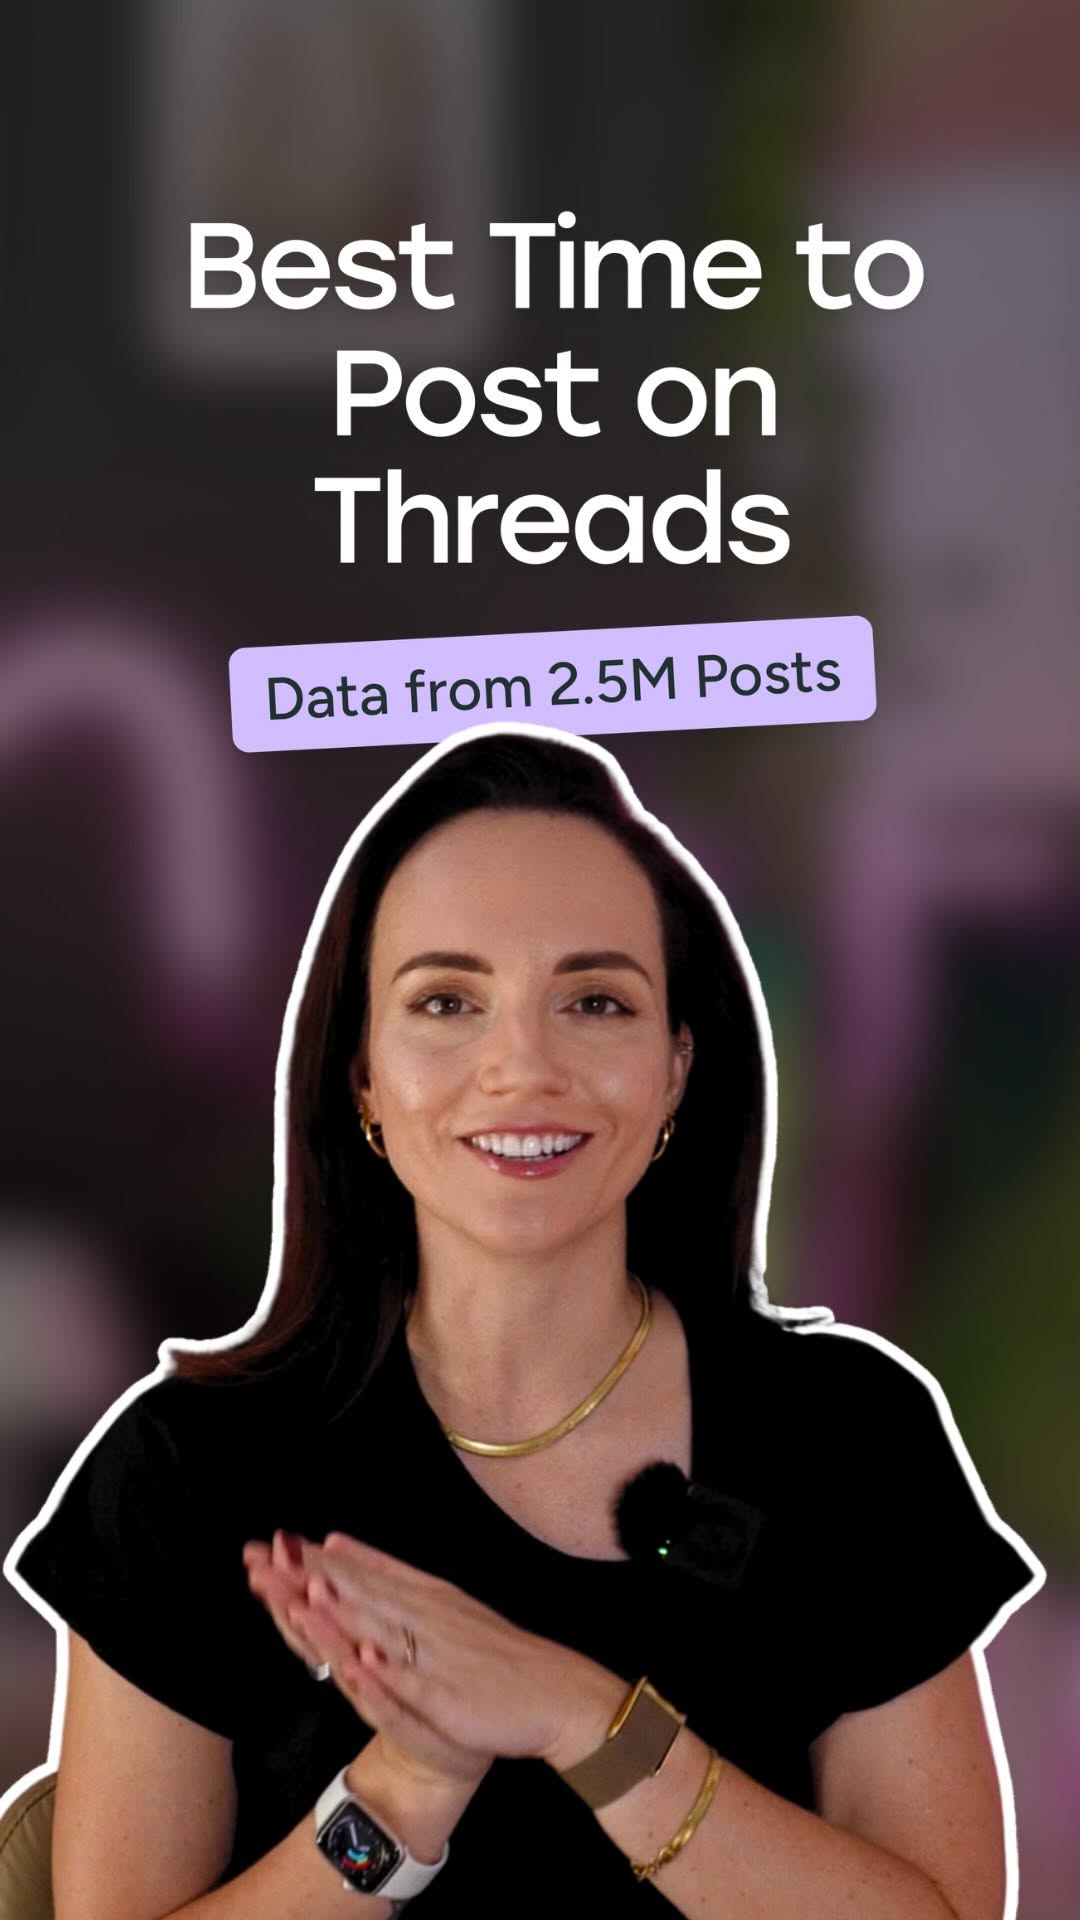
We analyzed 2.5 million Threads posts to find the best times to post.
Here are the top [X] things that actually [outcome] [emoji]
Used 4×
Here are the 3 things that actually grow your account

Here's a quick look at what we found: Late afternoons and evenings are now outperforming traditional working hours.

The top 3: Sunday at 9 a.m., Monday at 1 p.m., Sunday at 1 p.m.
Meet our newest teammate [and role] at Buffer: [Name]! [emoji]
Used 2×
Meet our newest teammate and Senior Engineer at Buffer: Bruno Paulino!

Meet our newest teammate & Senior Hiring Specialist at Buffer: Luke!
"[Relatable failure or doubt]" [Story setup of how they fixed it]
Used 2×
"I almost quit before I posted a single thing." @jillscarlet wanted to be a creator for years.

You open the composer. Stare at the blank box. Close the tab.
DAY [X]: Reporting live from [event/location]!
Used 3×
DAY 1: Reporting live from Buffer's 2026 annual retreat in Barcelona, Spain!
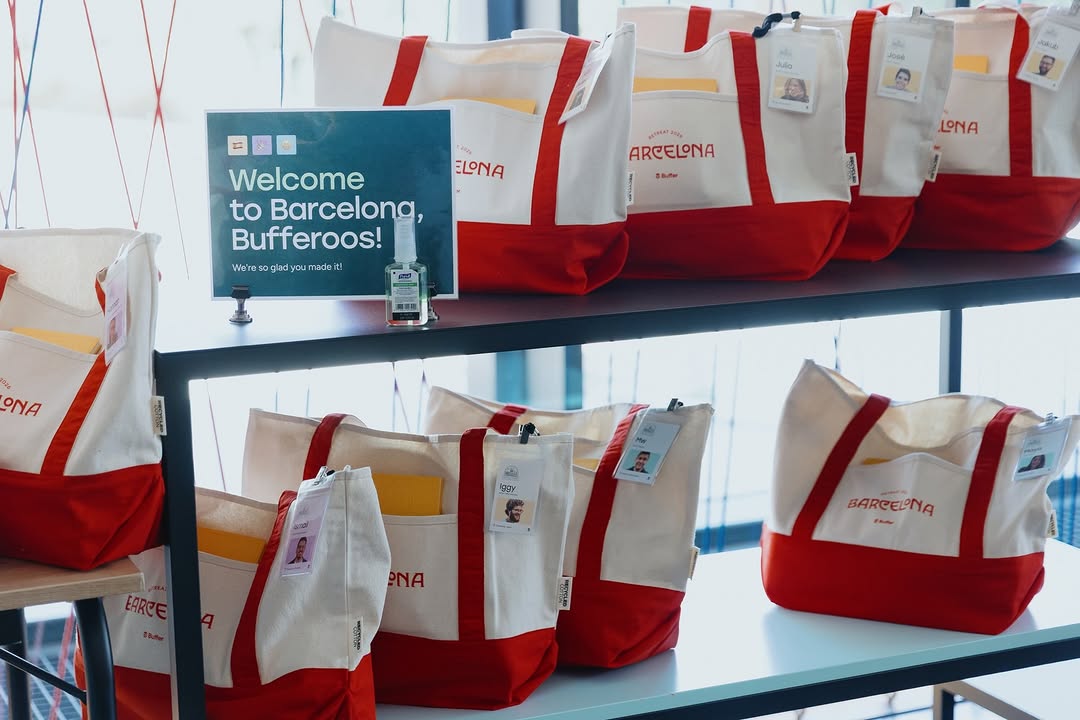
Buffer 2026 Retreat, Barcelona - Day 1 & 2

A little time capsule from the Buffer retreat in Barcelona!
05
Strategy summary
What's working, what to fix, and what to ship next.
TL;DR
The retreat content cluster is Buffer's single clearest engagement signal, with posts 8 and 9 each pulling 144-145 likes and post 8 earning 24 comments, the highest comment count in the set. By contrast, the product and feature reels that should be driving tool adoption averaged fewer than 30 likes each. The data-research pillar (posts 2, 20, 24) sits in a healthy middle band at 45-104 likes, suggesting it works but needs bolder creative execution to break out.
The biggest leak is posting cadence. At 2.3 posts per week against a healthy benchmark of 4, Buffer is leaving consistent reach on the table, particularly mid-week when its own research (posts 13, 20) points to Wednesday and Thursday as peak slots. The account is also not converting its research authority into saves or shares because the carousels rarely open with a direct tension or stakes statement.
UGC and employee-generated content account for roughly 37% of recent posts, and that content is outperforming brand-produced product posts by a wide margin. That gap is a strategic signal, not a coincidence. Leaning into employee voices with clear story arcs, the way post 8 does, will likely move the engagement floor up across all pillars.
Working
4- Employee-POV retreat reels (posts 8, 9, 21) consistently earn the highest likes and comments in the set.
- Research carousels citing specific post volumes (post 2: 45M posts, post 24: 52M posts) build credibility and earn saves.
- Relatable pain-point openers like post 19 (blank composer) and post 17 (almost quit) warm up cold audiences before the product pitch.
- Team intro carousels (posts 12, 14) generate steady mid-tier engagement and humanize hiring.
Risks
4- Product update reels (posts 11, 28) average under 25 likes. They need a user-problem hook before the feature reveal.
- Posting frequency at 2.3 per week is too thin. Mid-week slots are going unfilled despite Buffer's own data pointing to Wednesday and Thursday.
- Comment count is near zero on many posts. No CTA or question at the end of captions means no conversation is started.
- Design and engineering posts (posts 23, 27) get the least reach. Consider pairing them with a broader insight or trend to widen the relevant audience.
Ship next
5- Raise cadence to 4 posts per week, prioritizing Wednesday and Thursday 8-10am slots based on the account's own engagement data.
- Add a one-sentence stakes question to the final slide of every research carousel to drive comments and signal algorithmic conversation.
- Reframe product update reels with a user frustration in the first three seconds, then reveal the feature as the resolution.
- Brief two or three more employees to create retreat-style reels on regular work weeks, not just the annual retreat, to sustain that content pillar.
- Test a short series format, three linked reels on one research topic posted across one week, to build return-viewer habits and increase saves.
Unlock the full strategy
Create a free account and we'll unlock the rest of this report.
Unlock free